

The AAARRR Pirate Metrics framework offers a well-laid-out approach to focus on metrics that truly matter for your startup’s success.
Your business needs proper tracking of acquisition, activation, retention, referral, and revenue metrics to become adaptable and successful. Dave McClure introduced this framework in 2007 with a straightforward goal – helping startups concentrate on metrics directly affecting their business health.
The Pirate Metrics framework pushes us beyond vanity metrics like page views and teaches us to view growth as loops rather than straight lines. Every company, especially startups with new products, can benefit from this complete approach.
This piece walks you through each stage of the AAARRR funnel. You’ll learn how to implement it for your specific business and discover practical strategies that optimize your startup’s growth funnel from acquisition to revenue.
Table of Contents
-
- What Is the AAARRR Pirate Metrics Framework?
- Setting Up the Pirate Funnel
- Acquisition: How Users Discover You
- Activation: Creating the Aha! Moment
- Retention: Keeping Users Engaged
- Referral: Turning Users into Advocates
- Revenue: Monetizing Your Users
- Testing and Optimizing the Funnel
- Conclusion
- Key Takeaways
- FAQs
- What Is the AAARRR Pirate Metrics Framework?
What Is the AAARRR Pirate Metrics Framework?
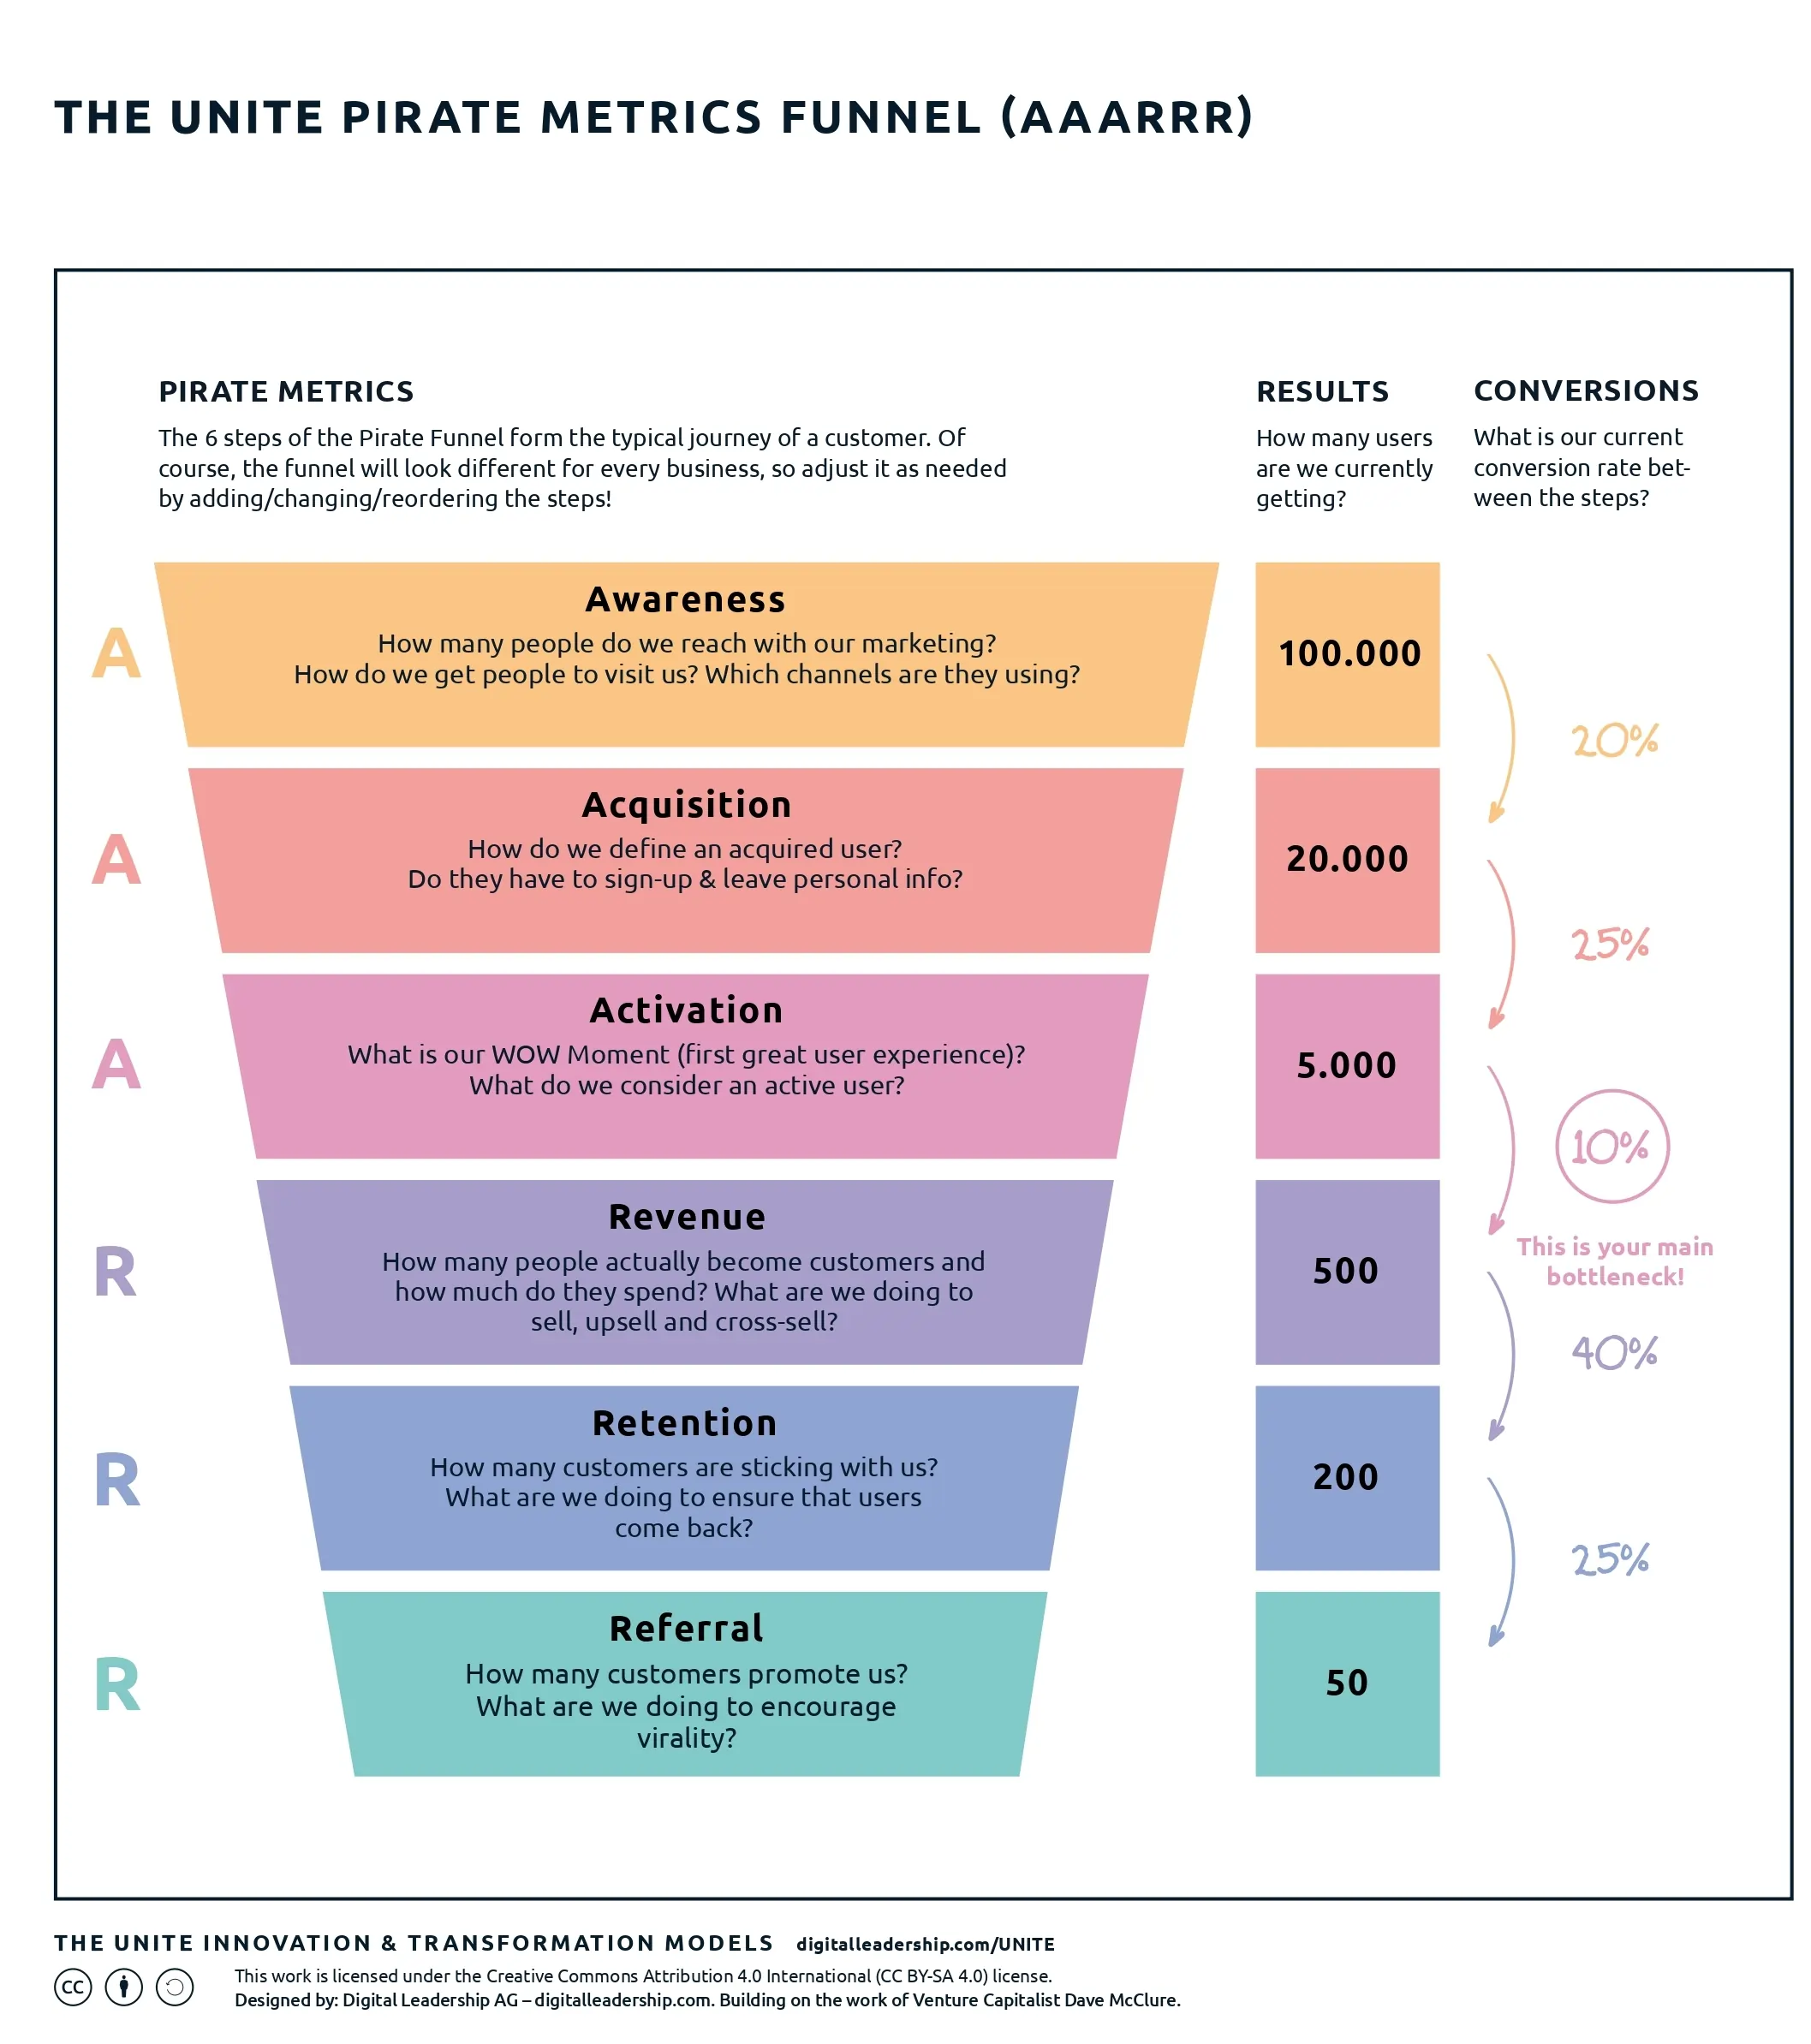
Image Source: Digital Leadership
The AAARRR Pirate Metrics framework offers an evidence-based way to understand the complete user experience. This well-laid-out method turns the messy, often subjective process of product development into a measurable sequence that propels development.
Origin and Purpose of the AARRR Model
Dave McClure, founder of 500 Startups and a prominent Silicon Valley investor, created the AARRR framework in 2007 during his “Startup Metrics for Pirates” presentation. He spotted a troubling pattern among young companies that got distracted by surface-level vanity metrics like social media followers or page views. These metrics looked good but didn’t lead to real business success.
McClure built the framework with two clear aims. He wanted to help startups focus only on metrics that affect business health. He also aimed to give these companies the right data to review their product management and marketing efforts so they could fix weak spots.
The framework changed how startups looked at metrics by offering a clear, applicable system. McClure believed companies should solve customer problems, make money from solutions, and earn more than they spend on building or providing them. His approach puts scalability and monetization first, unlike many founders who get caught up in features instead of finances.
Why It’s Called Pirate Metrics?
“Pirate Metrics” got its name from how AARRR sounds when you say it out loud – just like a pirate saying “AARRR, matey!” McClure picked this catchy name to add some fun to what could be a boring business concept.
The name does more than make people smile. The framework captures what McClure saw as the essential “pirate spirit” of entrepreneurship – bold, experimental, and results-focused. Product management and marketing professionals now commonly use this memorable nickname. The pirate connection helps people remember it and reminds them to be bold in startup environments.
How It Fits into the Startup Growth Funnel?
The AAARRR framework splits the user experience into five crucial stages that follow a natural flow:
- Acquisition: How users find your product
- Activation: How users first see value
- Retention: How users become regular fans
- Referral: How current users bring in new ones
- Revenue: How your product makes steady money
This way of organizing analytics helps you spot your biggest chances to grow. McClure suggests thinking about growth in loops instead of straight lines, unlike traditional marketing funnels. Each new user should start the next acquisition loop, which usually happens during referrals.
The framework acts as your business’s baseline truth source. Clear historical patterns make it obvious when things change, good or bad. You can pinpoint specific problems – if you keep users but don’t grow, you need better acquisition. If you get and activate users but don’t make money, you should focus on monetization.
Your business type and stage might make you prioritize these stages differently. Some companies switch to RARRA (retention, activation, revenue, referral, and acquisition) or add “awareness” to make AAARRR. You can adapt the framework to your needs while keeping focus on important metrics.
Product-led SaaS businesses find this framework particularly valuable because it uses the product as the main way to acquire users through freemium or free trial models. Measuring each stage lets you know exactly where, when, and how often users take desired actions with your product.
Setting Up the Pirate Funnel
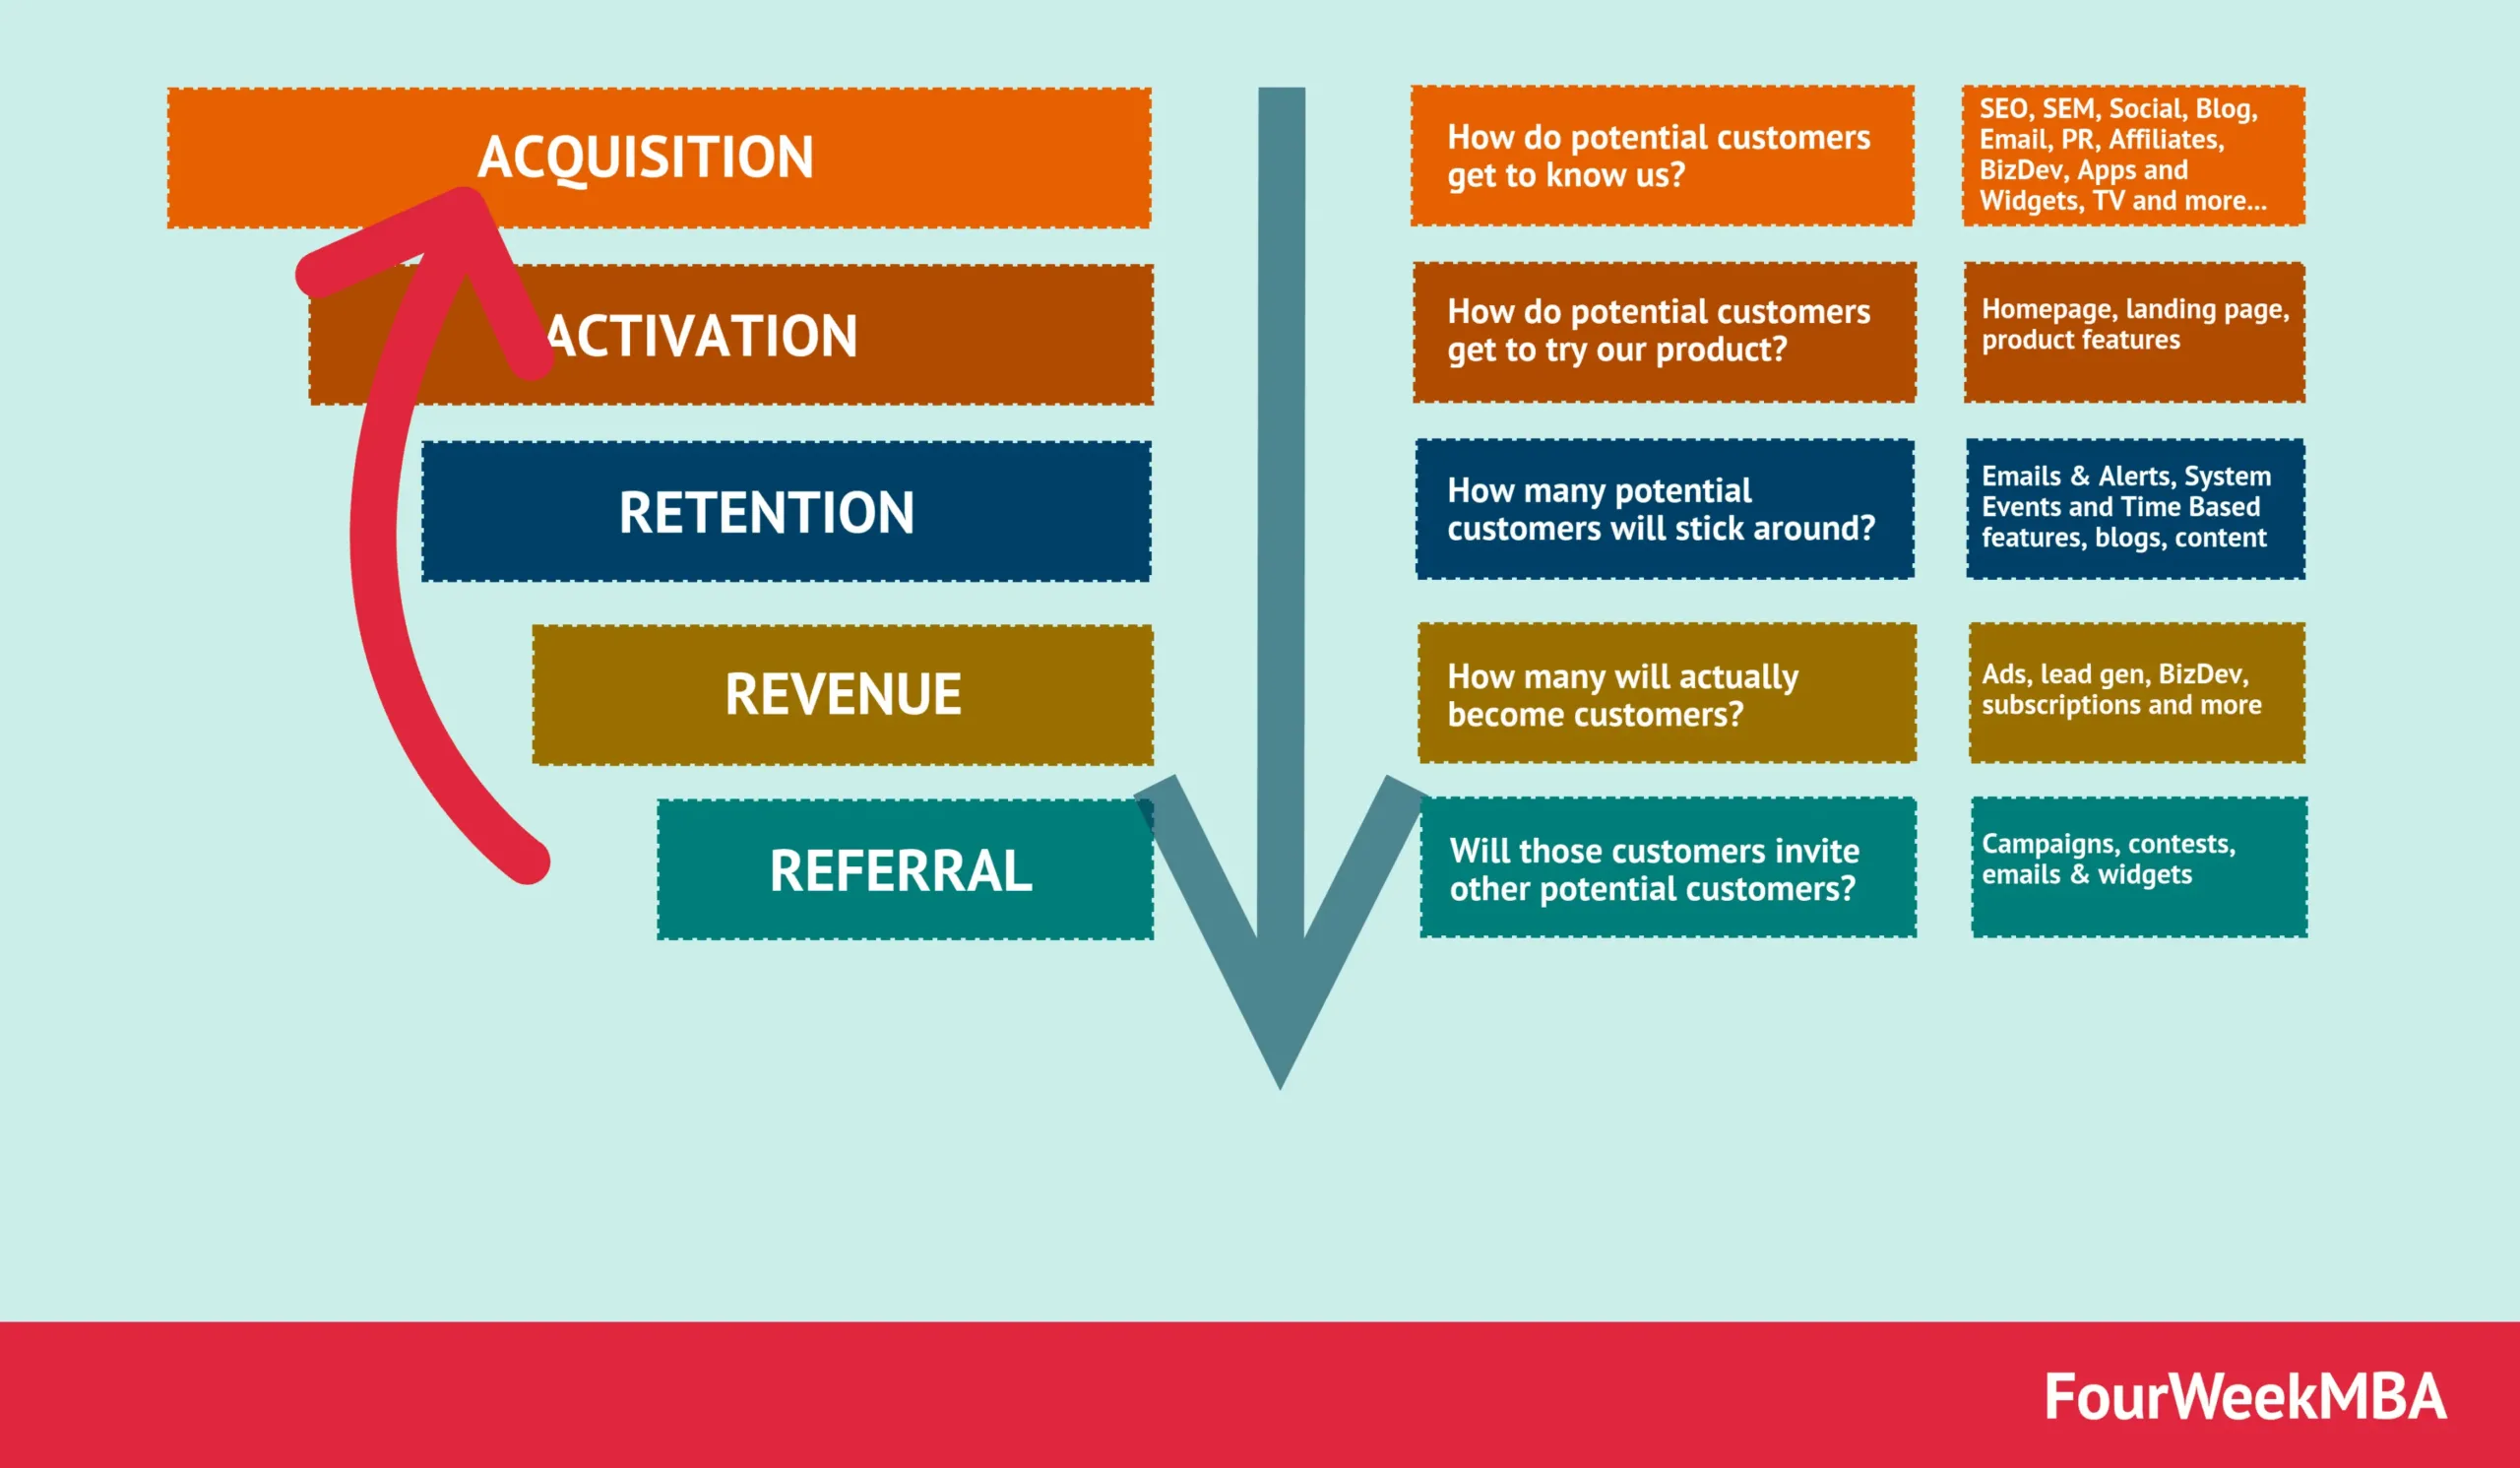
Image Source: FourWeekMBA
The AAARRR framework needs a systematic way to track the right metrics at each stage. The pirate funnel goes beyond data collection – it helps you find the user behaviors that matter most to your startup’s growth.
Understanding the Customer Lifecycle
The pirate funnel splits the customer’s trip into clear, measurable stages that support your growth strategy. Traditional AAARRR framework divides this trip into five vital phases: acquisition, activation, retention, referral, and revenue. Some models add an “awareness” stage at the start. This extended AAARRR model shows a complete picture of the customer’s lifecycle from first contact to loyal supporter.
Each stage marks a key shift in your customer’s relationship with your product:
- Acquisition: Users find and show interest in your product
- Activation: Users see your product’s value for the first time
- Retention: Users keep coming back to your product
- Referral: Happy users tell others about your product
- Revenue: Users become paying customers
This progression lets you fix problems at each stage systematically. To name just one example, looking at AAARRR metrics helps businesses spot weak areas in their marketing funnel and shows where users leave.
Mapping User Behavior to Funnel Stages
Your next big task is to spot specific user actions that show progress through each funnel stage. These behaviors become conversion metrics that signal success.
Acquisition metrics show how new users find your product and which channels bring the best leads. You might track website visits, ad clicks, or app downloads.
Activation is the turning point—when casual viewers become real users. SaaS businesses might track profile completions, while ecommerce companies watch first purchases. You need to find your product’s “aha moment”—when users truly get your value proposition.
Retention looks at behaviors that show ongoing interest, like return visits or feature usage. Good retention rates point to happy customers and make your marketing spend worthwhile.
Referral metrics tell you how well existing users bring in new ones. High referral rates mean your customers love your product.
Revenue metrics help you assess your monetization strategy, including average revenue per user (ARPU) and monthly recurring revenue (MRR).
Choosing the Right Tools for Tracking
Good tracking needs the right analytics tools. Digital products often use Google Analytics, KISSmetrics, or specialized platforms like Amplitude, MixPanel, or PostHog for detailed data collection.
These tools help you:
- Track user journeys across your funnel
- Find conversion rates between stages
- Run cohort analysis to understand retention patterns
- Test A/B variations to improve each funnel stage
Your tracking system should answer key questions at each stage. For acquisition: “Which channels bring valuable users?” For activation: “How fast do users reach their first value moment?” For retention: “What features bring users back?” For referral: “What makes users recommend your product?” For revenue: “Which user segments create the most lifetime value?”
Dave McClure suggests putting a dollar value on each type of user behavior. This money-focused view helps you prioritize improvements based on potential financial gains and ensures your growth efforts pay off.
After setting up tracking, use the data to test improvements at each funnel stage. This helps you better understand what pushes users through your pirate metrics funnel.
Acquisition: How Users Discover You
The AAARRR Pirate Metrics framework starts with acquisition – the moment potential users first find your product. This crucial stage helps you capture attention and motivates potential customers to take their first step with your business.
Top Acquisition Channels for Startups
Your business model, target audience, and available resources determine the quickest way to acquire customers. Different startups need different approaches:
- B2C Companies succeed with Instagram/Facebook ads, organic social media, influencer marketing, and marketplaces. Ecommerce businesses might also benefit from Pinterest, Google Ads, and Google Shopping.
- B2B Startups with high average revenue per user should emphasize sales through outreach and networking. They can generate leads through content, webinars, and targeted advertising on LinkedIn, Facebook, and Google.
- Niche B2B Businesses with low average revenue per user might need content marketing, community building, and product-led growth strategies.
Your target audience’s preferred platforms should guide your channel selection. Recent studies show that early-stage startups get better results from organic channels like SEO content and email outreach than paid ones. The best strategy focuses on 1-2 core channels instead of spreading resources across multiple platforms.
Key Acquisition Metrics to Track
Specific metrics help you assess which acquisition efforts bring the best results:
- Cost Per Acquisition (CPA) or Customer Acquisition Cost (CAC) shows your spending to acquire one new customer. A lower CAC points to optimized marketing and sales efforts. Divide your total marketing and sales spending by new customers won to calculate this.
- Click-Through Rate (CTR) reveals how often people click your marketing materials after viewing them. This shows your messaging’s power to generate interest.
- Conversion Rate represents the percentage of visitors who complete desired actions like signing up for trials or demos. Businesses in all types average about 2.2% visitor-to-lead conversion.
- Website Traffic growth rates establish baseline performance. A healthy measure shows 45% year-over-year visitor growth.
- Bounce Rate shows visitors leaving your site without action. This might signal problems with messaging or user experience.
SaaS businesses should track Activation Rate to learn about early product engagement through completed onboarding or first value achievement.
Tools to Measure Acquisition Performance
These tools help optimize your acquisition performance:
- Google Analytics (GA4) works as your foundation to measure channel performance and conversions. UTM tags with GA4 let you track campaigns and filter acquisition reports by campaign, medium, source, or channel to identify top-converting channels.
- Mixpanel tracks events like page views, purchases, and UTM campaigns. It creates reports on leading acquisition channels while comparing traffic sources.
- Salesforce helps you capture, track, and manage leads from multiple channels throughout customer acquisition.
- Zapier combines smoothly with different acquisition tools. It optimizes workflows by sending new leads to your CRM or enriching B2B lead data with job titles and company details.
- Mailchimp and similar marketing automation platforms help manage email campaigns and social posts – essential parts of most acquisition strategies.
Accurate measurement combines quantitative analytics data with qualitative insights from session replays, heatmaps, or customer surveys. This reveals not just your best channels, but why they succeed or fail.
Activation: Creating the Aha! Moment
Getting users is just the start. The next big step in the AAARRR Pirate Metrics framework is activation – the point where users first see your product’s real value. This stage turns casual browsers into active users who get what your product does.
What Defines Activation for Your Product?
Your product’s activation happens when users take specific actions during their first product experience. These actions could be checking out more pages, trying features, spending lots of time on your site, joining a newsletter, or starting a free trial. The main goal is to help users find your product’s true value and create those “aha” moments where basic exploration becomes real engagement.
Your startup’s growth funnel needs a clear definition of what activation means for your specific product. The activation stage bridges the gap between what users expect and what they actually experience. While acquisition focuses on getting found, activation is all about meaningful first-time use and interaction.
Key activation metrics to monitor include:
- Activation rate: The percentage of users who find their “aha” moment
- Time to activate: How long it takes users to move from acquisition to activation
- Free-to-paid conversions: The number of users converting from trials to paid subscriptions
- Onboarding completion rate: Percentage of users completing your initial setup process
Examples of Activation Events
Facebook offers a classic example of activation. They found that users who made seven friends in their first few days quickly saw the social network’s value. Getting those seven connections became Facebook’s defining “aha” moment and a reliable way to measure activation.
Different products have their own activation events:
- B2B SaaS products: Users successfully integrate their existing tools (like CRM) and see actionable insights
- HubSpot: Makes CRM onboarding easier with tooltips
- Dropbox: Gives free storage to get users started
- Ride-sharing apps: Users complete their first ride
- Email services: Users send their first email
The secret lies in finding which specific action shows users truly understand your product’s value. Looking at behavioral cohorts helps reveal how “aha” moments vary across different user groups.
Improving Onboarding and First-Time UX
The first-time user experience (FTUE) includes everything users think, feel, and understand until they reach that vital “aha” moment. A well-planned onboarding strategy can boost adoption and retention rates by helping users see your product’s value quickly.
Here’s how to boost activation through better first-time experiences:
- Know your users deeply: Run surveys and interviews to understand their needs, challenges, habits, and expectations
- Create journey maps: Map out possible scenarios users might face from their first product interaction
- Design accessible onboarding: Build clear UI/UX with helpful elements like progress bars, status notifications, and quick feedback
- Simplify the signup process: Ask only for essential information at first
- Provide contextual guidance: Use interactive walkthroughs that fit different user groups
- Implement onboarding checklists: Give users a clear path to initial success
A delightful activation experience can dramatically affect retention rates. Statistics show that all but one of these users abandon an app after one use, which shows why first impressions matter so much.
The main goal is to help users experience your product’s core value faster. Reducing your time-to-value metric improves your activation rate and strengthens your entire growth funnel.
Retention: Keeping Users Engaged
Retention is the life-blood of the AAARRR Pirate Metrics framework. It makes the difference between sustainable growth and getting pricey churn. Users need to find your product and experience their first “aha moment.” After that, keeping them involved becomes your biggest challenge and chance.
Why Retention Is More Important Than Acquisition?
Numbers tell the retention story clearly. Research shows companies spend 5-25 times more money to get new customers than keep existing ones. A 5% boost in customer retention can boost profits by 25% to 95%.
Many startups still chase acquisition over retention, and with poor results. This creates the “leaky bucket” problem – new users keep flowing in while existing ones leak away. SaaS companies feel this pain acutely. Their first $100M in new bookings might just replace customers who left.
Small and medium-sized businesses say repeat buyers generate more than half their revenue – about 61%. This means you’ll never see real growth if you can’t keep your customers, whatever your acquisition strategy might be.
How to Measure Churn and Stickiness?
The right retention metrics help spot problems before they turn into major revenue losses:
Churn rate shows the percentage of users who abandon your product in a specific timeframe. Companies usually track three types of churn:
- Customer/logo churn (lost customers)
- Gross dollar churn (lost revenue from churning customers plus downgrades)
- Net dollar churn (gross churn minus expansion revenue from existing customers)
This is a big deal as it means that expansion revenue from existing customers exceeds losses – that’s the gold standard for net dollar churn.
Stickiness shows how often users interact with your product. The Daily Active Users to Monthly Active Users ratio (DAU/MAU) measures this. A 20% ratio works well, while 25% or higher is exceptional.
Other key retention metrics include:
- Repeat usage rates: How often users come back
- Session intervals: Time between user sessions
- Customer Lifetime Value (CLV): Total revenue expected from a customer
Tactics to Improve User Retention
Smart retention strategies can substantially cut down churn:
- Reduce time to value – One company cut their time-to-first-value in half – from 60 to 30 days. They automated processes, built certificate programs, and set up drip email campaigns.
- Set up feedback loops – Learn how users feel about your product. Act on what they love, find frustrating, or wish you had.
- Make communication personal – Break users into groups and send messages that match their behavior. Show them unused features or offer help when they seem stuck.
- Build a community – Users who feel they belong stick around longer, even when small issues pop up.
- Start loyalty programs – Give long-term customers rewards and celebrate their milestones to show they matter.
- Keep improving – Regular updates and new features show your steadfast dedication to making the product better.
- Think over subscription models – When it fits, subscriptions make repurchasing easier and revenue more predictable.
Retention builds the foundation for lasting growth in the AAARRR Pirate Metrics funnel. Companies often chase flashy acquisition tactics instead. Yet retention ended up deciding if your startup builds lasting customer relationships or just expensive, temporary ones.
Referral: Turning Users into Advocates
The referral stage is a game-changing moment in the AAARRR Pirate Metrics funnel. Your satisfied customers become active promoters of your product. This stage makes use of one of marketing’s best channels – recommendations from people we trust.
What Makes a Referral Program Work?
Good referral programs turn happy customers into growth engines. Here are the main elements that make referral programs soar:
First, strong product satisfaction builds the foundations for referrals. Users who love your product will naturally tell others about it. The data shows happy users are nowhere near as likely to spread the word.
Second, double-sided incentives get people to participate. Studies reveal 65% of people prefer programs that reward both parties. This approach changes the mindset from helping a brand to sharing something valuable with friends.
Third, strategic placement of referral options gets more people involved. Referral buttons work best in places where customers already spend time – apps, dashboards, or confirmation screens. This cuts down friction and boosts participation.
Fourth, simplicity in participation breaks down barriers. The process should be easy with social media links, one-click sharing, and clear steps. This by a lot increases how many people take part.
Referral KPIs and viral coefficient
These key metrics help track how well referrals work:
- Net Promoter Score (NPS): Shows how happy customers are and if they’ll recommend
- Number of invites shared: How many invitations active users send out
- Recipient conversion rate: How many invited people become users
- Viral cycle time: Time it takes for users to invite the next group
- Viral coefficient: How many new users each existing user brings in
The viral coefficient (K-factor) needs special attention. It shows your program’s potential for exponential growth. When it’s above 1, each customer brings more than one new customer, which creates self-sustaining growth. Here’s how to calculate it:
Viral coefficient = Number of invitations sent per user × Conversion rate of invitations
Examples of successful referral strategies
Dropbox’s referral program is a soaring win story. They gave extra free storage to users who brought in friends. This made their product better the more people shared it, which led to massive growth.
Morning Brew shows how tiered rewards work well in their newsletter program. They push daily updates and give better rewards as people refer more friends. This keeps their super-fans excited about sharing.
Blume keeps things simple with their “Become a Blume Buddy” program. Both parties get $10, making it easy to understand and motivating for everyone.
Timing plays a huge role too. The best referral programs spot “advocacy triggers” – those perfect moments when customers feel great about the product and want to tell others. These moments might come after a purchase or when they find cool features.
These principles and examples show how to turn happy users into growth drivers for any startup.
Revenue: Monetizing Your Users
The revenue stage in the AAARRR Pirate Metrics framework turns your previous efforts into lasting business success. Your startup growth puzzle comes together after you acquire, activate, retain and generate referrals. Monetization becomes the final piece that completes this picture.
Revenue Metrics That Matter
Several financial indicators help track monetization progress:
- Average Revenue Per User (ARPU): Shows each customer’s average revenue generation and helps identify opportunities to upsell or cross-sell
- Monthly Recurring Revenue (MRR): Shows predictable revenue that repeats each month – a vital metric for subscription-based businesses
- Net Revenue Retention (NRR): Shows revenue retained over time, measured monthly
- Customer Acquisition Cost (CAC): Shows your spending to acquire each new customer
Expansion MRR stands out as a significant indicator for SaaS businesses as it shows revenue growth from existing customers. Gross profit margin tracking ensures your revenue converts into actual profits.
LTV vs CAC: Finding Profitability
Customer Lifetime Value (LTV) and Customer Acquisition Cost (CAC) relationship remains the most significant metric to grow sustainably. The LTV:CAC ratio reveals your business health:
- Most investors see 3x LTV:CAC as a standard of financial health
- Your valuation could triple when LTV:CAC improves from 2x to 3x
- A higher LTV:CAC lets you reinvest more profit back into your business
The ratio calculation needs your customer lifetime value divided by acquisition cost. LTV comes from average monthly customer gross profits divided by monthly revenue churn rate. CAC sums all sales and marketing expenses divided by new customers added in that period.
Optimizing Pricing and Upsells
Smart pricing strategies and upselling opportunities maximize revenue:
- Value-Based Pricing works best especially when you have SaaS and subscription businesses. This prices products based on customer-perceived worth rather than production costs. The 10x rule suggests your product should deliver value worth at least ten times its price.
- Upsells and Cross-Sells create revenue growth paths once users invest in your product. Additional revenue flows without extra acquisition costs when you offer upgrades based on usage history.
- Discount Strategy needs careful planning. More than 70% of practitioners believe discounts boost conversion. However, these short-term gains often hurt long-term success. Strategic time-boxed discounts work better than making them your main pricing approach.
These revenue metrics and strategies build a lasting growth engine that transforms pirate metrics into real business value.
Testing and Optimizing the Funnel
A successful AAARRR Pirate Metrics implementation relies on constant optimization. The real work starts with systematic testing and refinement based on actual user behavior after you establish your funnel.
Running A/B Tests at Each Stage
Your pirate funnel optimization needs extensive experimentation at every stage. Dave McClure suggests numerous A/B tests to find improvement opportunities throughout the customer experience. Different versions of onboarding screens yield valuable explanations because these critical touchpoints substantially affect activation rates. The acquisition tests should compare different marketing channels to determine which brings the highest quality leads. You can then experiment with various referral incentives to maximize your viral coefficient.
Using Cohort Analysis for Insights
Cohort analysis offers deeper understanding than broad metrics by grouping users with shared characteristics or behaviors. This approach reveals patterns that remain hidden in total data. Your most engaged users’ actions become clear through cohorts, which helps guide others toward those behaviors. Teams can spot exactly where and why users drop off in the funnel by analyzing cohorts over time. Different user segments can be compared against each other or against your broader user base to find optimization opportunities.
Iterating Based on Data
Evidence-based iteration eliminates guesswork from growth strategies. Changes should be implemented methodically after collecting insights through testing and cohort analysis. McClure’s suggestion includes spending 80% of effort on refining existing features and only 20% on developing new ones. Metric tracking becomes valuable only when you act on the collected insights. Each experiment needs careful crafting, and results should be analyzed to make informed decisions about future improvements.
Conclusion
The AAARRR Pirate Metrics framework changes chaotic startup growth into a measurable, systematic process. This proven methodology helps businesses focus on meaningful data that directly affects success, moving away from vanity metrics.
Your biggest growth opportunities become clear quickly after putting this framework to use. You’ll spot problems in acquisition, activation, retention, referral, or revenue generation right away. This targeted approach works better than random experiments.
User retention is the life-blood of sustainable growth. Most companies focus on acquisition, but keeping existing users involved determines your startup’s long-term success. A 5% boost in retention can increase profits by 25-95%, making this metric worth optimizing.
Smart decisions in your pirate funnel should come from data. Testing at each stage combined with cohort analysis shows which strategies work best for your business. These informed choices let you improve without guesswork.
AAARRR metrics shine through their connected nature. Good retention creates better referrals. Strong activation boosts retention rates. Quality acquisition sources improve activation. Understanding these connections helps create growth cycles instead of isolated improvements.
Dave McClure’s framework began with a pirate’s “AARRR,” but its effect on startup success is real. Of course, using these metrics needs commitment and consistent measurement. The clarity and direction they provide make it worth the effort.
Your startup needs more than hope and intuition – it needs a proven system for growth. The AAARRR Pirate Metrics framework delivers exactly that.
Key Takeaways
The AAARRR Pirate Metrics framework provides startups with a systematic approach to measure and optimize growth across five critical stages, transforming chaotic development into data-driven success.
• Focus on retention over acquisition – It costs 5-25x more to acquire new customers than retain existing ones, and a 5% retention increase can boost profits by 25-95%
• Define your “aha moment” precisely – Identify the specific user action that represents value discovery (like Facebook’s “7 friends in 10 days”) to optimize activation rates
• Track LTV:CAC ratio religiously – Maintain at least a 3:1 lifetime value to customer acquisition cost ratio for sustainable profitability and investor confidence
• Use cohort analysis for deeper insights – Group users by shared behaviors to identify patterns hidden in aggregate data and discover optimization opportunities
• Test systematically at each funnel stage – Run A/B tests on acquisition channels, onboarding flows, and referral incentives while spending 80% effort refining existing features
The framework’s interconnected nature creates virtuous growth cycles where strong retention drives referrals, effective activation improves retention, and quality acquisition enhances activation rates. Success requires consistent measurement and data-driven iteration rather than relying on vanity metrics or intuition alone.
FAQs
Q1. What Are the Key Stages of the AAARRR Pirate Metrics Framework?
The AAARRR framework consists of six key stages: Awareness, Acquisition, Activation, Retention, Referral, and Revenue. Each stage represents a critical point in the customer journey, from first discovering your product to becoming a loyal, paying customer who refers others.
Q2. Why Is Retention Considered More Important Than Acquisition in This Framework?
Retention is crucial because it’s much more cost-effective to keep existing customers than to acquire new ones. Increasing customer retention by just 5% can lead to a 25-95% increase in profits. Strong retention also drives referrals and creates a foundation for sustainable growth.
Q3. How Can I Identify My Product’s “Aha Moment” for Better Activation?
To identify your product’s “aha moment,” analyze user behavior to pinpoint the specific action or experience that demonstrates your product’s value to new users. This could be completing a certain task, achieving a goal, or using a key feature. Once identified, optimize your onboarding process to guide users to this moment as quickly as possible.
Q4. What’s the Significance of the LTV:CAC Ratio in the Revenue Stage?
The LTV:CAC (Lifetime Value to Customer Acquisition Cost) ratio is a critical metric for assessing business health and profitability. A ratio of at least 3:1 is generally considered healthy, meaning each customer generates three times more value than it costs to acquire them. This ratio helps ensure sustainable growth and is often used by investors to evaluate startups.
Q5. How Can I Use Cohort Analysis to Improve My Startup’s Performance?
Cohort analysis involves grouping users based on shared characteristics or behaviors and analyzing their performance over time. This method can reveal patterns in user behavior, helping you identify what actions lead to higher retention or revenue. By comparing different cohorts, you can pinpoint areas for improvement in your product or marketing strategies and make data-driven decisions to optimize each stage of the AAARRR funnel.
About The Author
Get A Free Consultation
I can help you grow your B2B business.
Ready to Generate 40-80+ Qualified Leads/Month?
Get a free 30-minute Growth Blueprint call. You’ll learn:
- Your current cost per lead vs. industry benchmarks
- Which channels are leaving money on the table for firms like yours
- A 90-day roadmap to predictable lead generation
- Specific positioning recommendations for your segment
No sales pitch. Just honest advice.
